For a data engineering course, working in a group of five, I built a small pipeline that pulls student grade data out of MongoDB, cleans it up in R, and turns it into something you can actually analyse and model.
The raw data lived in a MongoDB collection, one document per student with an array of exam, quiz, and homework scores nested inside it. I connected to the database directly from R using the mongolite package, pulled every record, and used an aggregation pipeline to unwind that nested scores array into flat rows before exporting it to a CSV I could keep working from.
From there it needed proper tidying before it was usable: each student's scores were spread across multiple rows, one per assessment type, so I pivoted the data into a wide format, one row per student with a column for exam, quiz, and each homework score, which made it straightforward to compute an average and total score per student.
With the data in shape, I summarised it by assessment type (max, min, mean, median) and visualised it two ways: average score trending by class, and average score by assessment type.
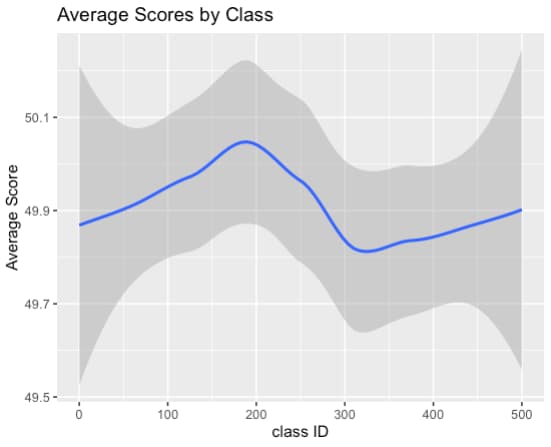
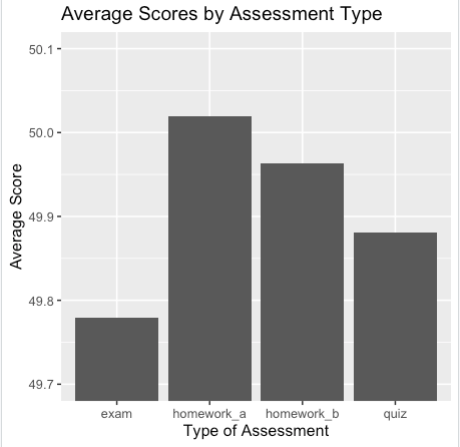
I then went a step further and built a few linear models to see what actually predicts a student's average score: exam score alone, class and student ID as categorical predictors, and a mix of categorical and continuous ones, comparing each by its prediction error (RMSE). The model using just class ID and student ID came out most accurate, more so than the ones built from exam or quiz scores, which says something about how much of the variation in this dataset came down to which class and student it was rather than performance on any single assessment.